Explore existing answers
When you find an existing answer in Explore, you can temporarily dig deeper into the chart and change what you see, without saving any changes. For example, even if you don't have permission to edit a liveboard, you can still explore the data in these ways.
Explore any type of chart or table
- To edit what you see in the chart or table, select the
Explore button in the top right corner of the
answer. (If you don't see it there, select More
 .) Then use the Filter,
Add, Replace, and
Compare tools.
.) Then use the Filter,
Add, Replace, and
Compare tools. - To see the underlying data in table format, select
More
, or right-click on a data point. Then select Show
underlying data.
- To filter an entire liveboard based on data from one answer, see Filter liveboards.
Explore pivot tables
You can filter, sort, and change the aggregation rules for pivot tables as shown in
this example:
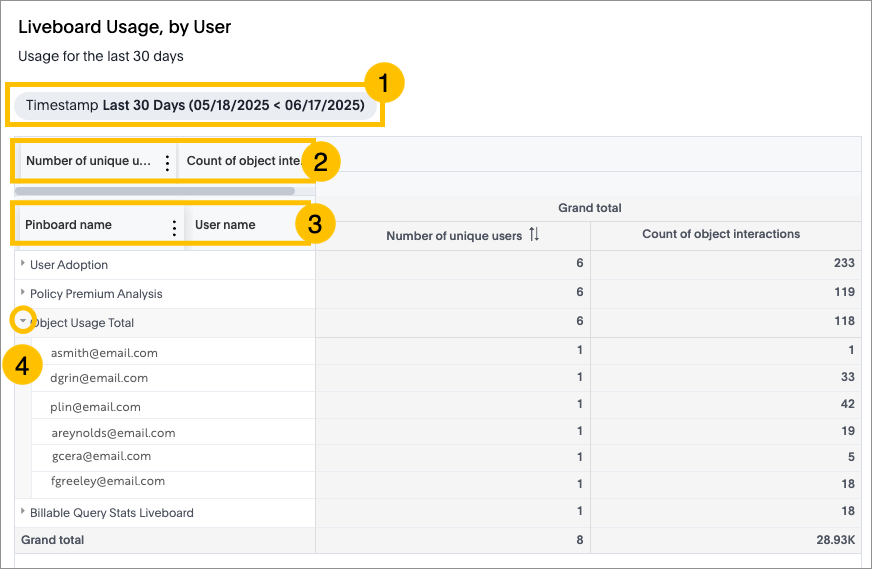
- Filter the entire table: If the table creator added a filter or parameter, it's located below the answer title. Select it to choose the filter or parameter values.
- Filter by column values: The table columns are listed at the top of the table. You might need to scroll horizontally to see all of them. Hover over one and select the ellipsis to Filter, Sort, or change the Aggregation rule. For example, you can filter to only show rows with more than 5 unique users.
- Filter by row values: The table rows are listed below the columns. You might need to scroll horizontally to see all of them. Hover over one and select the ellipsis to Filter or Sort. For example, you can filter to only show totals for specific users.
- See subtotals: Select the arrow next to a row to expand it and see subtotals. The example shows totals for pinboards and subtotals for specific users.