Monitor KPIs
In Explore, KPIs are a chart type that provide visibility into key business metrics. Add KPIs to a personal watchlist and monitor them through alert subscriptions.
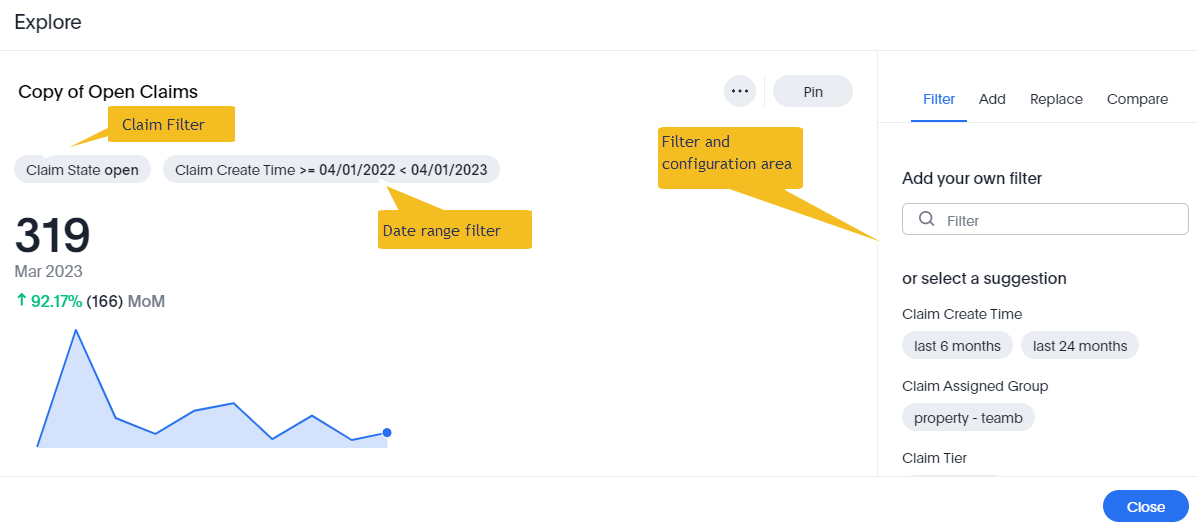
When you create an answer, Explore automatically selects the KPI chart type if it's appropriate. Or, you can edit the chart to select it yourself. For example, the following chart shows the number of open claims for a given period in a month-to-month KPI chart.
Add KPIs to your watchlist
About this task
You can add important KPIs to your personal Watchlist on the Home page.
Procedure
-
On the home page in the Insights
 workspace, select Add KPI to
watchlist.
workspace, select Add KPI to
watchlist.
What to do next
Get KPI alerts with Monitor
Monitor is an Explore alert subscription service that sends email notifications and
in-app notifications about changes in KPIs. Follow these steps to configure Monitor:
- There are multiple ways to start creating an alert:
- Alerts are automatically created for KPIs that you add to your watchlist on the Insights home screen.
- Open a liveboard, then select Create alert
 for any KPI answer.
 - Open an answer, then select More
 > Create alert.
- Choose an alert type. Each type belongs to one of these categories:
- Anomaly: Get an alert when data is outside of a predicted value range. Predictions are made by ML models trained on the data. You specify when and how often Explore checks for an anomaly. If there's a temporary anomaly outside of the time you specify, you won't get an alert.
- Threshold: Get an alert when the data crosses a set limit. You specify when and how often Explore checks the data. If it temporarily reaches the threshold outside of the time you specify, you won't get an alert.
- Schedule: Get regular updates about the KPI data on a schedule.
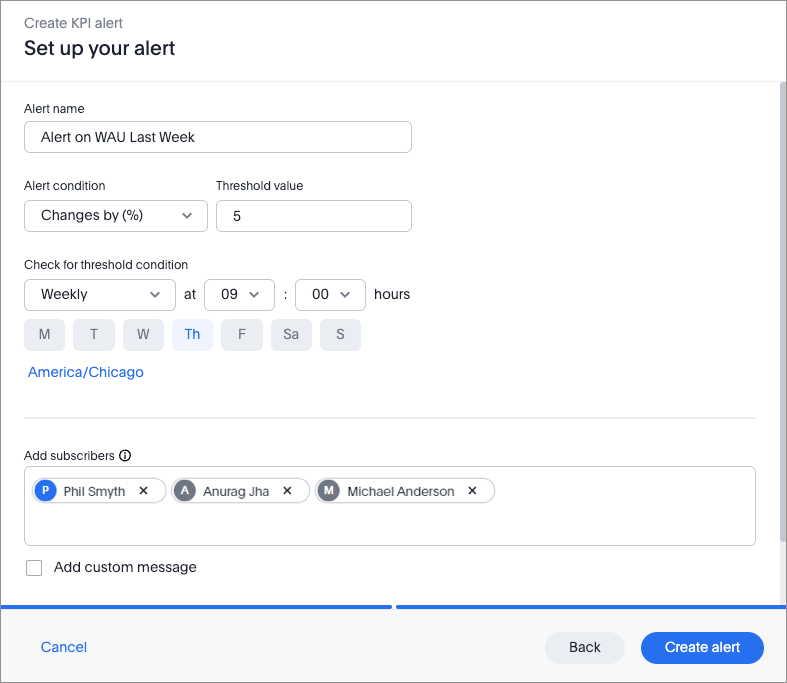
- Set the alert details, such as the name, conditions, and time.
- Add subscribers (individual users or groups) for your alert.
- (Optional) Add a custom message to be sent with the alert.
- View the KPI query for the alert.
- Select Create alert.
Edit alerts
Select Monitor subscriptions in the Insights workspace. Select More
for the alert you wish to edit. Choose from the following options:
- Edit alert: edit the parameters for the alert.
- Add subscribers: add or remove subscribers from the subscribers list.
- Delete alert: permanently delete the alert.
Unsubscribe from alerts by selecting Unsubscribe for your selected alert.