Performance audits
Lighthouse
Lighthouse is an open-source, automated tool for creating audits of web pages.
When auditing a page, Lighthouse runs a barrage of tests against the page, and then generates a report. From here, you can use the failing tests as indicators of what you can do to improve your app.
The audit focuses on 5 main areas:
- Performance
- Progressive Web App
- Accessibility
- Best practices
- SEO
Generating the audit
You can use Lighthouse either as a Google Chrome extension or as a part of Chrome DevTools.
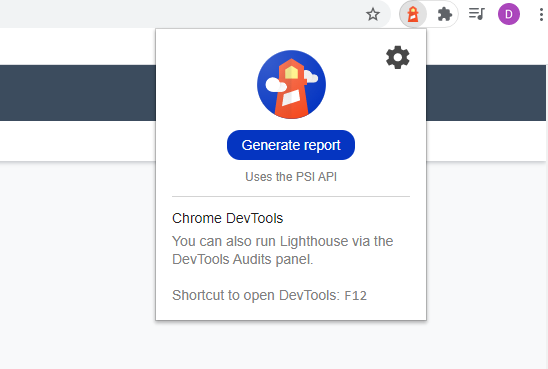
To run Lighthouse as a Google Chrome extension you need to first install it in Chrome Web Store. Then click the extension's icon in the browser and click the Generate report button.

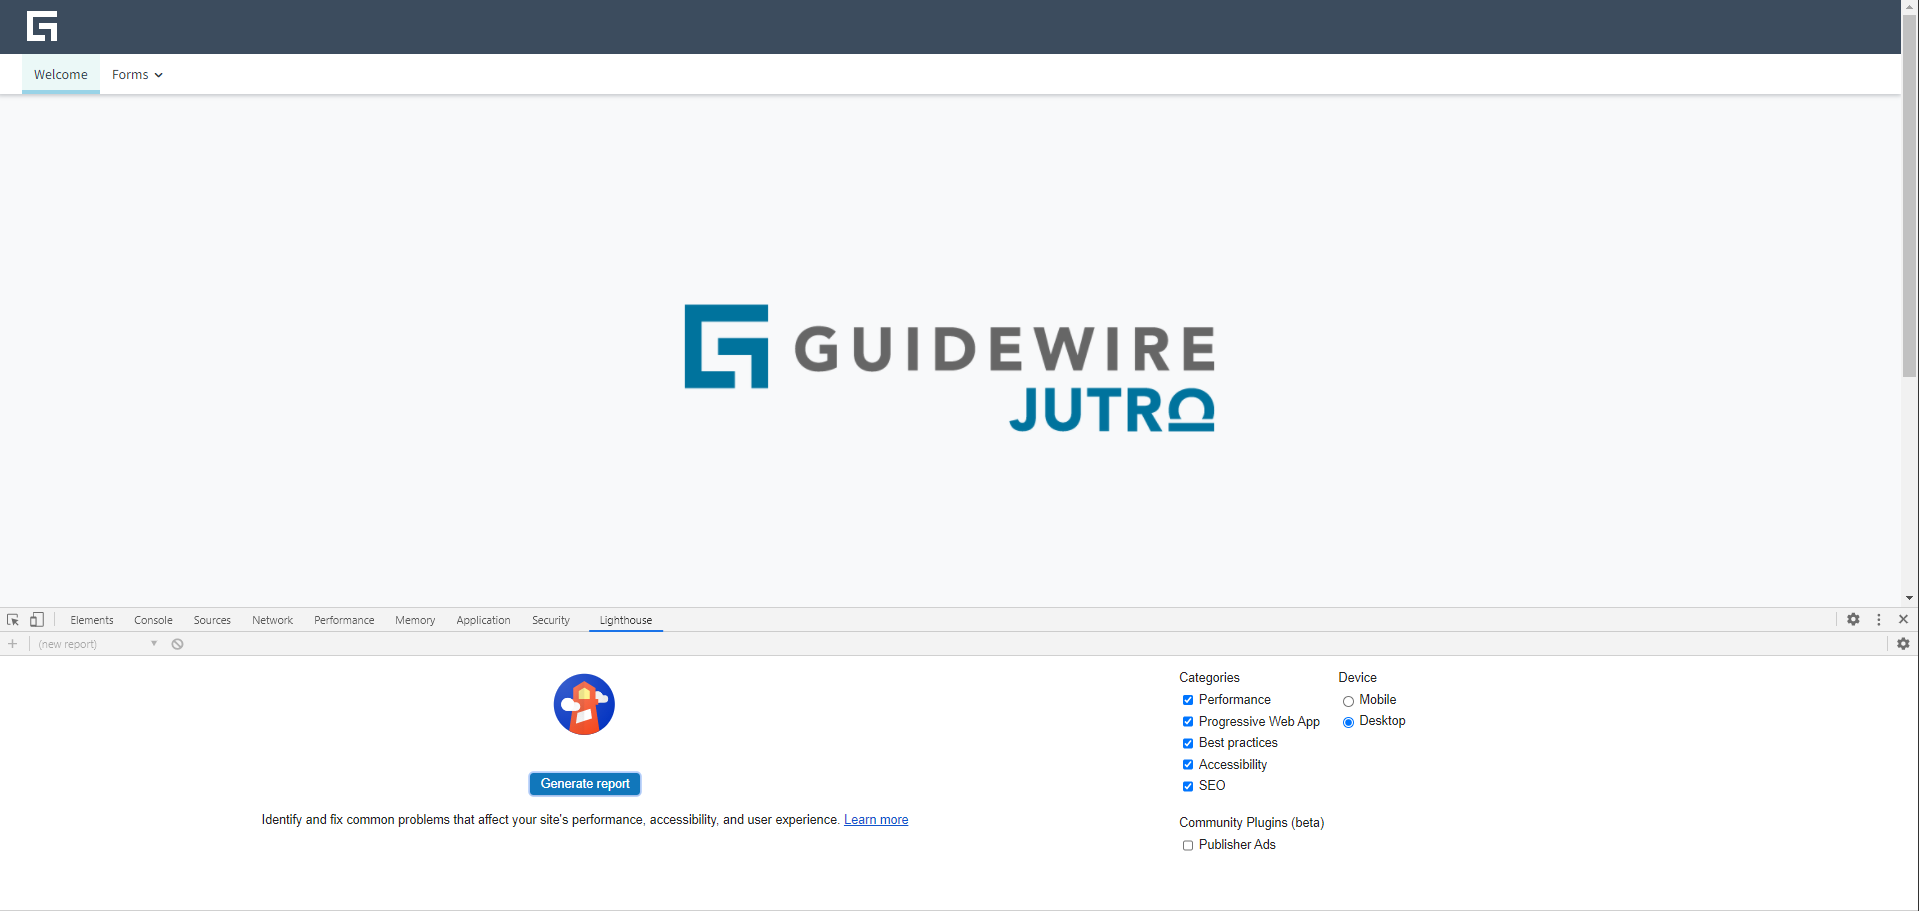
To run Lighthouse as a part of Chrome DevTools right click on the page and choose Inspect. Then switch to the Lighthouse tab and click the Generate report button.

Understanding the performance audit
Lighthouse rates every audited area on a scale of 0 to 100, where 100 is the best score. The tool never shows the score 0 - if it does it means that there was a Lighthouse error.

Performance audit covers different aspects of the web page's activity. Lighthouse loads the chosen page and checks how long it takes users to hit various performance milestones - these are called metrics. The Performance score is a weighted average of the metric scores. The weightings are chosen to provide a balanced representation of the user's perception of performance.
You can find more information about how Lighthouse calculates the performance score in Lighthouse documentation
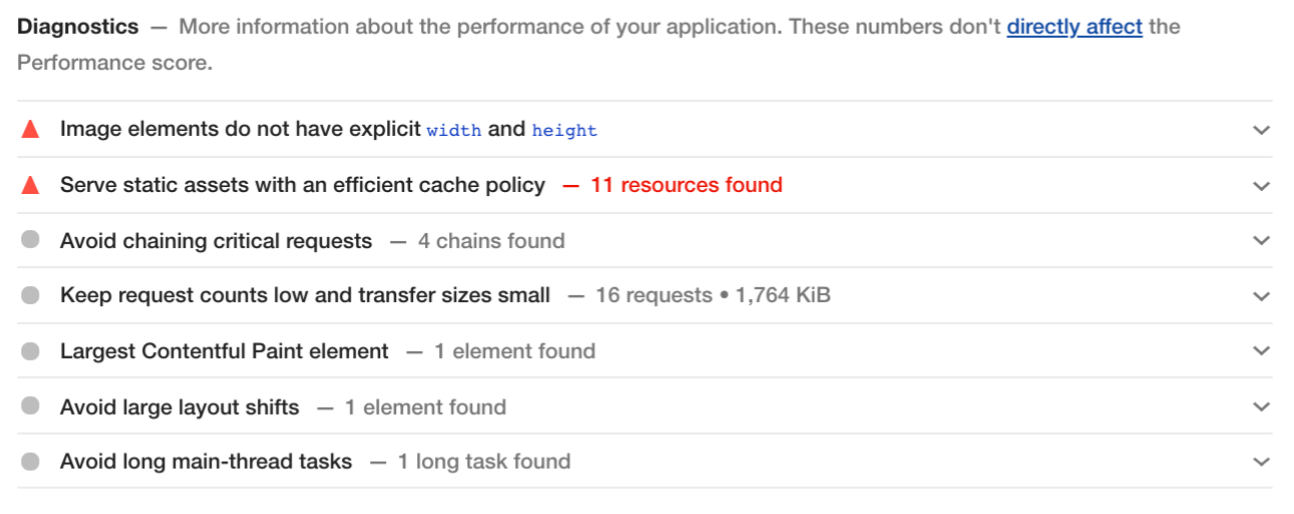
The report provides a score for each metric but also a list of Opportunities and Diagnostics. The results of Opportunities or Diagnostics do not contribute to your Lighthouse Performance score. That said, improving the opportunities and diagnostics is likely to improve the metric values, so there is an indirect relationship.

